Market Returns Volatility based on Markov Chain Monte Carlo
Introduction
The variance of returns of assets tends to change over time. The stochastic volatility model (SV) attempts to model this variance by assuming that they follow some latent stochastic process. However, even the simplest SV model is difficult to fit due to various reasons. Naive strategy of maximum likelihood estimation fails due to the fact that the marginal distribution is evaluated in high dimensional space. Monte Carlo Markov Chain (MCMC), on the other hand, faces difficulty in simulating some non-analytical distributions and people needs to resort to indirect approach such as Metropolis-Hastings algorithm or reject-accept sampling.
This article is about using MCMC algorithm for SV model. And model is applied in estimating the stock price volatility of 600891:CH in Shanghai Stock Exchange. All experiments are implemented using Jupyter Notebook under Python3.
Theory
Consider \(y_{t}, t = 1,2,...N\) is the stock price series, the standard stochastic volatility model is:
\[y_{t} = \sqrt{h_{t}}\cdot u_{t}, u_{t}\sim N(0, 1)\] \[lnh_{t} = \mu + \phi\cdot lnh_{t-1} + \sigma_{n}\eta_{t}, \eta_{t}\sim N(0,1)\]where \(h_{t}\) is the unobserved log-volatility of \(y_{t}\), the error terms \(\mu_{t}\) and \(\eta_{t}\) are Gaussian white noise sequence, \(\phi\) is the volatility resistance, and \(\sigma_{n}^2\) is the standard deviation of the volatility.
Experienment
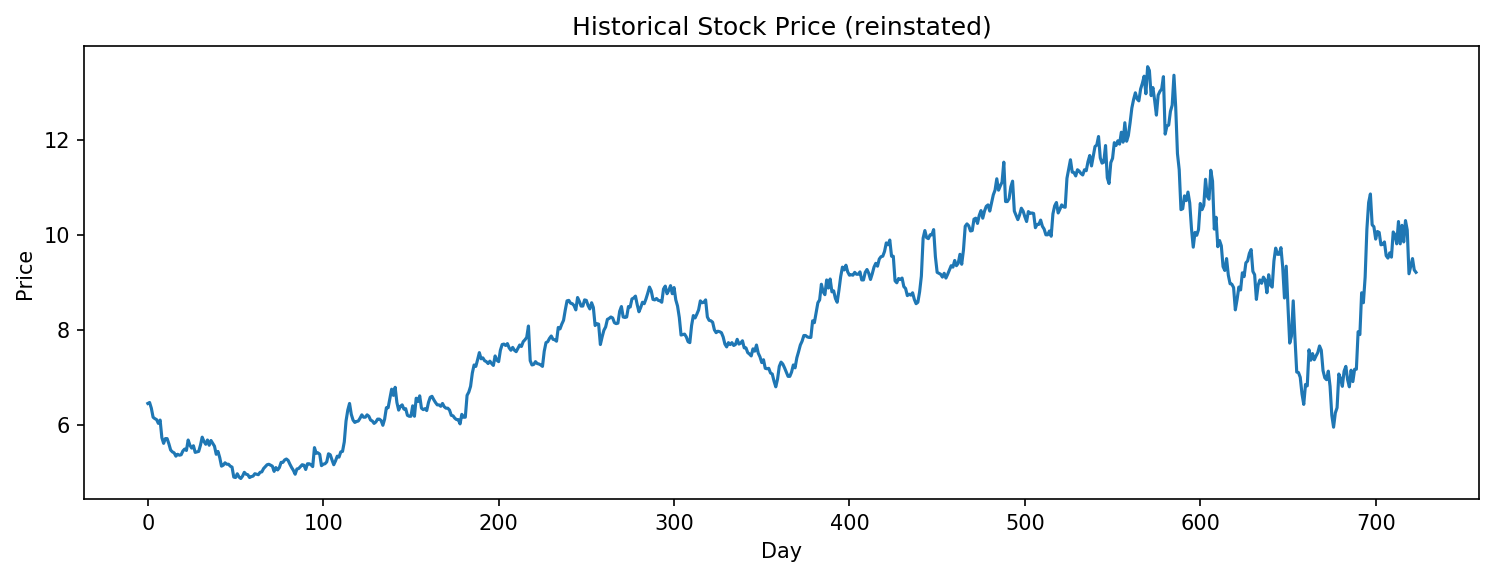
Data samples are the index of Harbin Churin Group Jointstock Co Ltd (stock quote: 600891:CH), from Shanghai Composite. The data range is from November 22, 2015 to November 22, 2018. And data was collected using TuShare, which is a Python package designed for crawling historical and Real-time Quotes data of mainland China stocks.
The equation of the return rate is defined as:
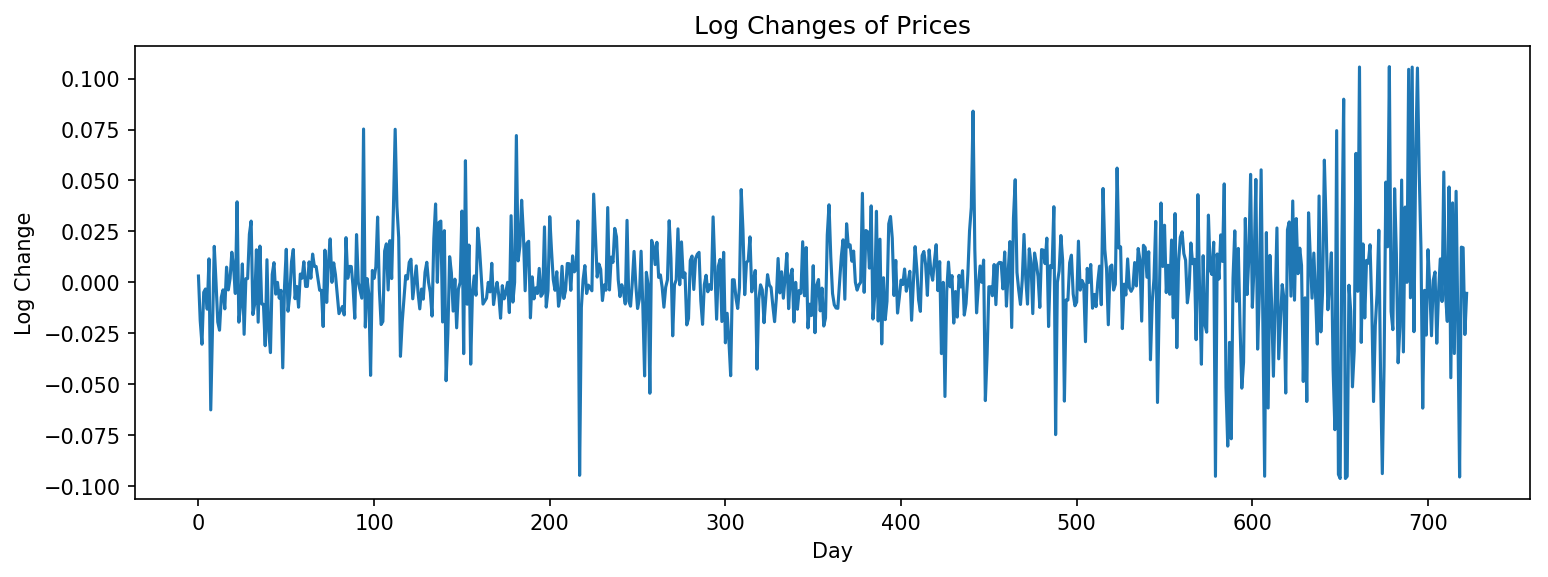
\[y_{t} = log(price_{t+1}/price_{t})\]where \(price_{t}\) is the closing price at day t.
The stock price of 600891:CH during the given period (11/22/2015~11/22/2018) and the log change of prices during that period.


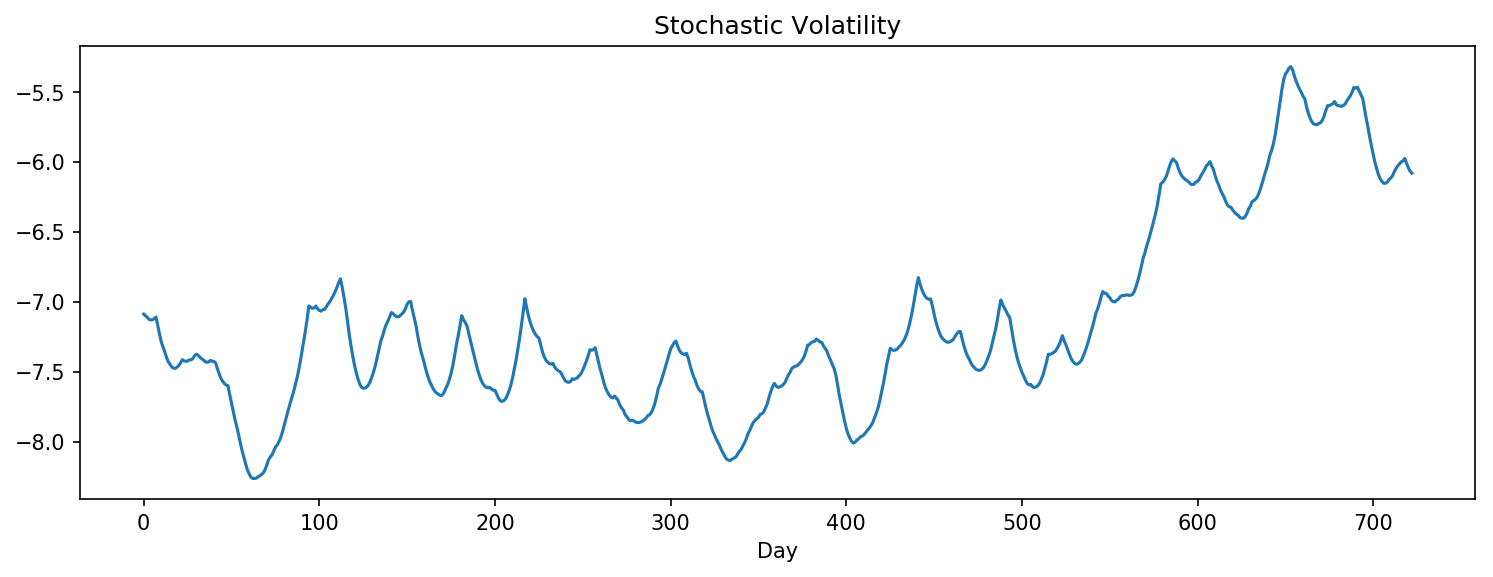
All sampled h:

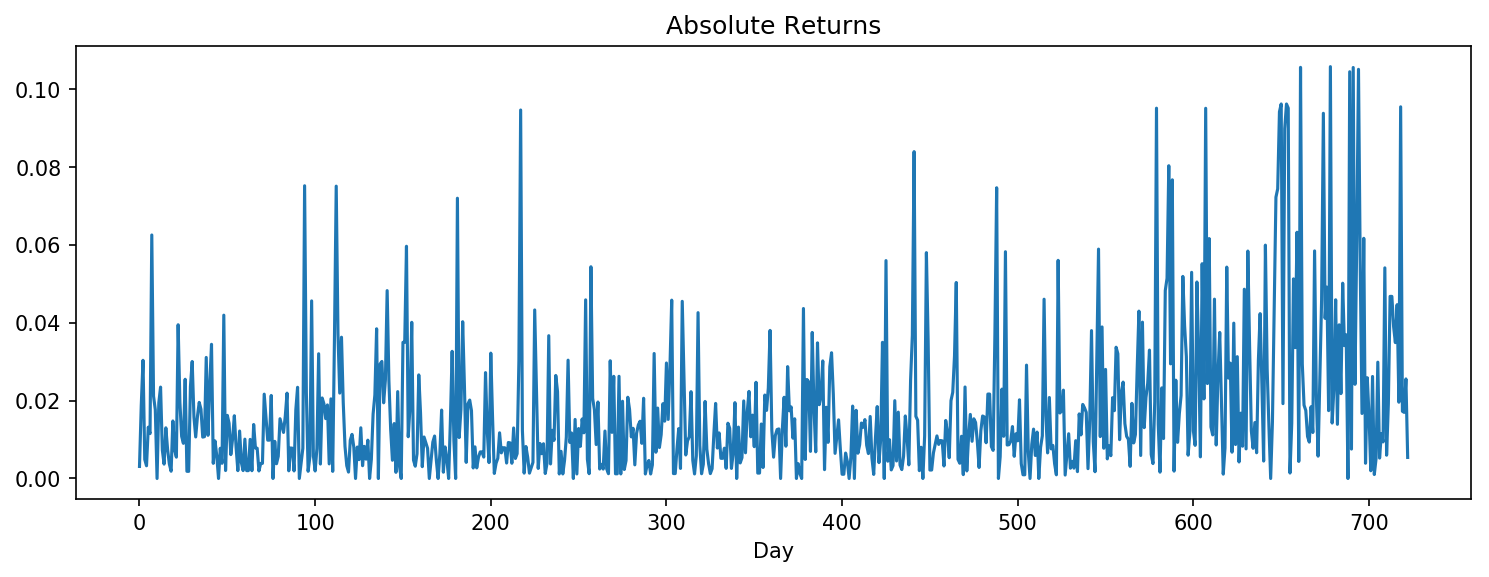
| The estimated stochastic volatility (mean of all sampled h) and absolute returns ($$ | y_t | $$) |


From above two figures, one can see that the estimated stochastic volatility closely mimics the movements of absolute returns.
Detailed report is available here!
Reference
[1] Eric Jacquier, Nicholas G. Polson and Peter E. Rossi, “Bayesian Analysis of Stochastic Volatility Models”, Journal of Business & Economic Statistics, 1994, Vol. 12, No. 4
[2] Kim, S., Shephard, N., & Chib, S. (1998). Stochastic volatility: Likelihood inference and comparison with ARCH models, Review of Economic Studies 65: 361–393